WHAT IS SATELLITE REMOTE SENSING?
In this article we are going to explore what remote sensing is, how satellites obtain various data about the surface of our planet while being hundreds of kilometres away, and why is this technology so valuable in today’s changing world.
FIRSTLY, WHAT DOES REMOTE SENSING MEAN?
Throughout history, remote sensing has been defined in various ways. By briefly looking at all these definitions we can identify a central idea: the acquisition of information about an element from a distance. In other words, remote sensing represents the method through which data about objects, areas or environmental phenomena is collected, with the help of devices equipped with sensors that are not in physical contact with these elements.
DID YOU KNOW?
Aerial photography is the earliest form of remote sensing and it first began in 1840s withnewly-invented photo cameras capturing images of Earth’s surface from hot-air balloons. Later, during the 1900s the cameras found new platforms to be mounted on, among which homing pigeons were a European novelty!
HOW DOES SATELLITE REMOTE SENSING WORK?
Satellite remote sensing is performed via satellites mostly orbiting the Earth at relatively low altitudes (600-800 km from the planet’s surface), equipped with active and passive sensors used for Earth Observation (EO) purposes. The radiation recorded by the sensors is then transmitted to a processing station, where the received data is processed in the form of an image, just like the one seen below. The data products are further interpreted in order to extract information about the observed targets, which would later be utilised for various applications.
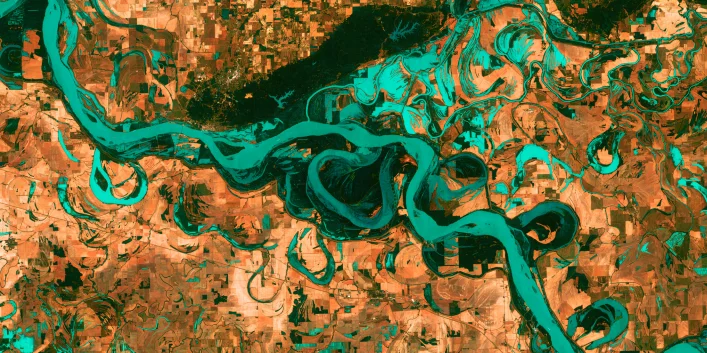
LANDSAT 7, IMAGE OF THE MISSISSIPPI RIVER © USGS EROS DATA CENTER
PASSIVE VS. ACTIVE APPROACHES
The two primary types of sensors (passive and active) represent the fundamental difference between remote sensing systems.
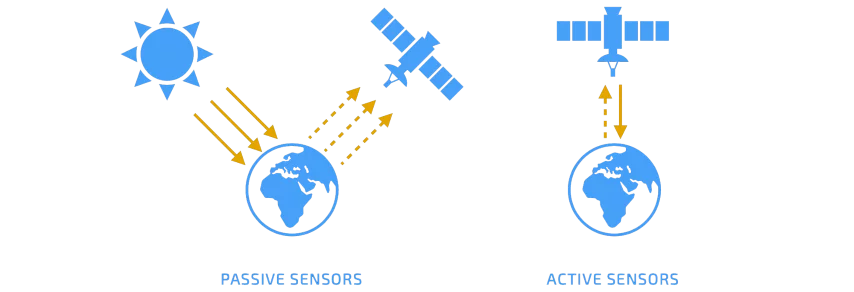
PASSIVE REMOTE SENSING uses passive sensors that record natural radiation reflected or emitted by Earth’s surface or atmosphere. The most common source of radiation is represented by reflected sunlight, which accounts for a portion of the electromagnetic radiation emitted by the sun. Examples of passive sensors include various kinds of radiometers or spectrometers, which operate mostly in the visible, infrared, near-infrared, thermal-infrared, and microwave parts of the electromagnetic spectrum. These instruments can measure signals at several spectral bands simultaneously, creating colour, multispectral or hyperspectral images, from which a broad diversity of properties can be derived, such as surface temperature or geological physical characteristics, to only name a few. Main disadvantages? Passive remote sensing requires constant sunlight and most sensors are unable to see through dense cloud cover. On the bright side, optical remote sensing is the only type able to collect true-colour images of Earth.
ACTIVE REMOTE SENSING uses active sensors, which emit artificial radiation in the direction of the target and subsequently measure the radiation reflected or backscattered by the target’s surface. Examples of active sensors include different types of LiDAR (Light Detection and Ranging) and RADAR (Radio Detection and Ranging) technologies, scatterometers or altimeters, with the majority operating in the microwave band of the electromagnetic spectrum. As a result, they are immune to any weather conditions and can see in the dark, thus can fully function day and night, which is critical for many missions, including rescue operations. Additionally, SAR (Synthetic-Aperture Radar), remote sensing can even penetrate vegetation and obtain valuable surface layer information, such as soil moisture content. Among many other applications, active sensors are especially important in volcanology, forestry and glaciology. Main disadvantage? The pulse power can interfere with other sources of radiation, and therefore more processing and analysis is required for a clear interpretation.
DID YOU KNOW?
Launched on March 1st 1984, Landsat 5 set the record in 2013 for the 'Longest-operating Earth observation satellite’ in the Guinness World Records. Designed with a life expectancy of only three years, the satellite delivered global high-quality data for 28 years and 10 months, before being decommissioned on June 5th 2013.
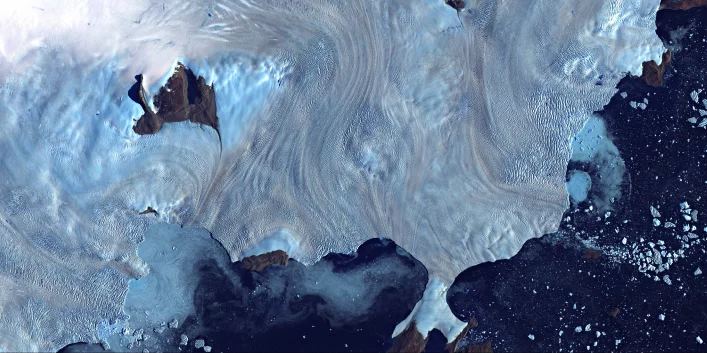
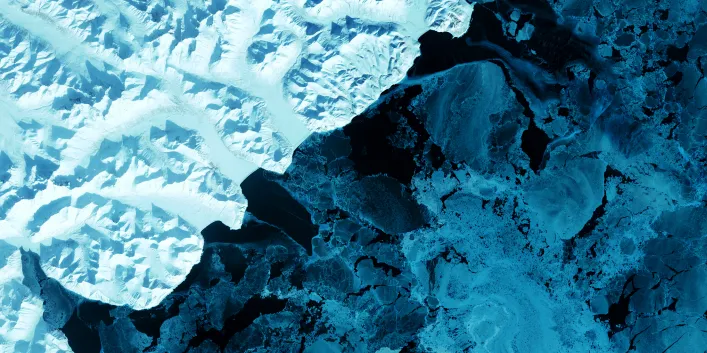
LANDSAT 7, IMAGE OF GREENLAND’S WESTERN COAST © USGS EROS DATA CENTER
RESOLUTION, RESOLUTION, RESOLUTION
In remote sensing, the resolution of images plays a critical role in how the information obtained by a sensor can be utilised. In a nutshell, the resolution characterises the degree of potential details provided by an image - the higher the resolution the more detail it holds. As an illustration, think of a photograph and its pixel count: the higher the number of pixels, the greater the quality. Same principle can be applied for remotely sensed imagery.
It is important to know that remote sensing data is generally characterised by four primary types of resolution, as we are going to see further on. Depending on the design of the sensors and the orbit of the satellite, the resolutions of the datasets can vary greatly and it is equally difficult and expensive to acquire images with extremely high resolutions all across the board. Consequently, a practical solution usually employed is a trade-off between resolutions, based on what type of data is required for each mission and study. For instance, some applications require a greater level of detail on ground, while others need wider portions of land to be observed in one pass. As a result, one resolution can be lowered in favour of another. In order to better understand this concept, let’s take a closer look at the four kinds of resolution.
SPATIAL RESOLUTION is determined by the size of each pixel and the area on Earth’s surface the pixel represents. Simply put, if an image has a spatial resolution of 10 meters it means that each pixel depicts a 10 m x 10 m area on the ground. It must be remembered that in this case, the lower the number, the more details we can see (a pixel representing 10 meters offers more information than a pixel illustrating 100 meters).

RADIOMETRIC RESOLUTION is the sum of information stored in each pixel, specifically the number of bits that reflect the captured energy (data bits per pixel). As each bit records a power 2 exponent, an 8 bit resolution is 28, meaning the sensor has up to 256 digital values (0-255) to store data. For a 16 bits resolution the sensor has 65,536 potential digital values (0-65,535) and so on. The more values available to store data, the greater the radiometric resolution. The higher the resolution, the wider the spectrum of radiation intensities it can distinguish and register, allowing for a clearer detection of even the faintest variations in reflected and emitted energy.

SPECTRAL RESOLUTION is represented by the number of spectral bands an instrument is able to record. In other words, this resolution is represented by a sensor’s ability to distinguish specific wavelengths by having more and narrower bands. Thus, this type of resolution is higher as the range of wavelengths are narrower and it can additionally be defined by the width of each band the sensors observe. Furthermore, based on the number of bands a sensor has, they can be classified as follows: panchromatic (one black & white band), colour (3 RGB bands), multispectral (3-10 bands) and hyperspectral (hundreds to thousands of bands). Another key point to know is that certain bands and combinations are particularly useful for detecting specific features. As an example, in order to trace healthy and green vegetation within a given dataset, researchers use the Normalised Difference Vegetation Index (NDVI), which is obtained from the near-infrared and visible light recorded, using the following expression: NDVI = (NIR — VIS)/(NIR + VIS). Based on the intensity difference between the near-infrared and visible wavelengths reflected, the density and type of vegetation can also be assessed, e.g. forest or tundra.
TEMPORAL RESOLUTION refers to the period of time between two consecutive data acquisitions for a certain region. To put it differently, it represents the necessary amount of time a satellite needs to complete an orbit and return to the same observation point, hence why this resolution is sometimes known as the “revisit time”. In the case of satellites, the set temporal resolution depends mainly on orbital characteristics and swath width (size of the surface area observed by the sensor). The revisit times vary from satellite to satellite (e.g. daily, weekly, bi-monthly) and usually, in order to achieve a higher temporal resolution, the spatial one is reduced as a result.
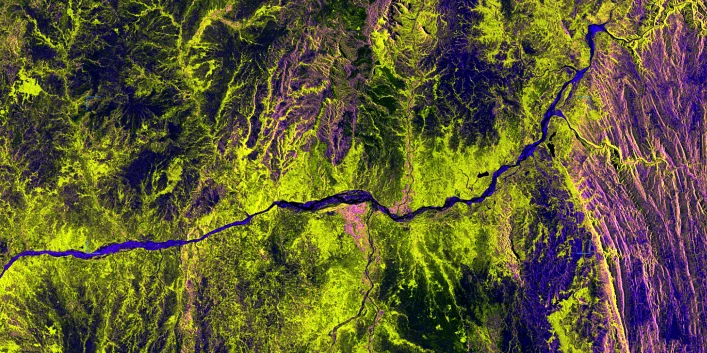
SENTINEL 1, SAR IMAGE OF A MADAGASCAR REGION © EOS DATA ANALYTICS
DID YOU KNOW?
Five of the most compelling motivation factors behind the approval of early remote sensing programmes, such as the early Landsat missions, were: the need for acquiring better information in regards to the geographical distribution of Earth’s resources, national security, commercial opportunities, international cooperation and international law.
VALUABLE INFORMATION
Why is remote sensing important? Generally speaking, because the acquired information offers a series of unique advantages for the study of our Earth’s surface and its atmosphere. This imaging technique is particularly important when it comes to observing highly inaccessible perimeters in a safe manner, monitoring changes over time or even taking immediate action in emergency situations. Additionally, data analysts can observe whole patterns instead of isolated points, and thus derive correlations between distinct features which would otherwise seem independent. This further facilitates data-informed decision making in various research fields and industries, based on the present and future state of our planet.
Where is remote sensing used? From climate research to geological mapping and resource management, this type of data can be used in a vast range of scientific, commercial, environmental and administrative applications. However, it is important to bear in mind that a single sensor may not be enough to provide all the answers needed for an application, and thus multiple sensors and data products need to be employed together, especially when we take into account that datasets are acquired at distinct wavelengths and resolutions.
Below are a few examples of how remote sensing data is being used today:
-
AGRICULTURE: land management, crop monitoring
-
ARCHEOLOGY: detection of subsurface remains, site monitoring
-
CLIMATE CHANGE: glacier melting rate, sea level measurements, surface temperature
-
CONSERVATION: wildlife, and habitat analysis, illegal hunting and fishing
-
DEFENSE: surveillance and target tracking
-
DISASTER RESPONSE: floods and fires monitoring, relief operations
-
FORESTRY: mapping invasive species, illegal logging
-
GEOSCIENCES: resource exploration, hazard analysis
-
HEALTHCARE: air pollution, disease outbreaks tracking
-
LAND USE: urban planning, infrastructure monitoring
-
SAFETY: iceberg detection, illegal border crossings
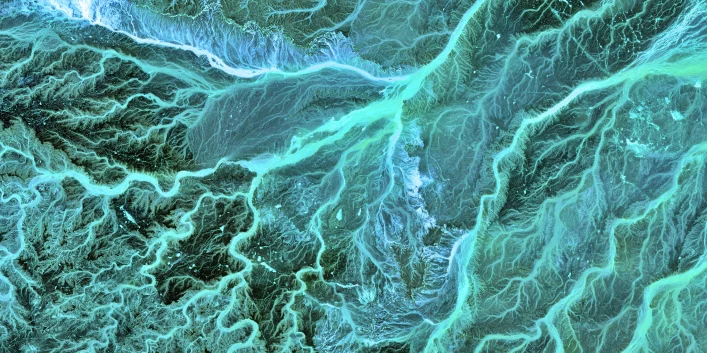
TERRA SATELLITE (ASTER DATA), IMAGE OF SOUTHEASTERN JORDAN © USGS EROS DATA CENTER
THE FUTURE OF REMOTE SENSING
THE FUTURE OF REMOTE SENSING
Due to the many advantages space-borne surveys proved to offer, they are more in-demand than ever before, which can be easily assessed by looking at the rate of Earth observation satellites being launched into orbit each year. For this reason, the access to remote sensing data is becoming progressively easier, faster and cheaper. That, coupled with new technologies being rapidly developed and space commercialisation being underway, indicates that satellite data is expected to become increasingly common across many more industries and research fields.
In terms of data analysis, the next step towards quicker, automated and unbiased feature classification or change detection within a data-stream is the implementation of machine learning (ML) and artificial intelligence (AI) algorithms. We are already seeing exciting work being developed and implemented when it comes to AI-driven remote sensing solutions, from specimen classification to algorithms being trained to predict upcoming events, such as imminent volcano eruptions.
If you are curious about satellite data and would like to experiment first-hand how to analyse and retrieve information from remotely sensed imagery, there are a number of open-access databases and analysis tools you may use free of cost. For instance, through USGS’s EarthExplorer platform you can search and download a variety of Landsat data products, while QGIS is an open-source GIS application that supports satellite image analysis. For more information on how to use the EarthExplorer platform in order to access the data, please see the following guide developed by the United States Geological Survey.
REFERENCES
1. Australia and New Zealand CRC for Spatial Information, 2018. Earth Observation: Data, Processing and Applications. Volume 1A: Data - Basics and Acquisition. [online] Available at: <https://www.crcsi.com.au/assets/Consultancy-Reports-and-Case-Studies/Earth-Observation-reports-updated-Feb-2019/Vol1A-high-res-112MB.pdf> [Accessed 21 April 2021].
2. Australia and New Zealand CRC for Spatial Information, 2018. Earth Observation: Data, Processing and Applications. Volume 1B: Data - Image Interpretation. [online] Available at: <https://www.crcsi.com.au/assets/Consultancy-Reports-and-Case-Studies/Earth-Observation-reports-updated-Feb-2019/Vol1B-high-res-75MBpdf.pdf> [Accessed 21 April 2021].
3. Canada Centre for Remote Sensing n.d. Fundamentals of Remote Sensing. [online] Available at: <https://www.nrcan.gc.ca/sites/www.nrcan.gc.ca/files/earthsciences.pdf> [Accessed 22 April 2021].
4. Dempsey, C., 2019. Before There Were Drones: Using Pigeons for Aerial Photography. [online] Geography Realm. Available at: <https://www.geographyrealm.com/before-there-were-drones-using-pigeons-for-aerial-photography/> [Accessed 22 April 2021].
5. EarthData NASA, 2021. What is Remote Sensing? | Earthdata. [online] Available at: <https://earthdata.nasa.gov/learn/backgrounders/remote-sensing> [Accessed 22 April 2021].
6. Liverman, D., 1998. People and pixels. Washington, D.C.: National Academy Press, Chapter 2.


